Alabama statewide home sales decline 13% year-over-year in June
Home sales in the state declined in June as rising mortgage rates pushed more buyers from the market. Sales declined 13.1% year-over-year (Y/Y) and are down 3.2% year-to-date. However, housing demand remains above pre-COVID levels, with June sales 6.6% above the five-year average. Additional declines are likely in the months ahead, with a 5-10% slowdown expected from last year’s pace. Home sales price growth moderated in June, with the statewide median sales price rising 11.7% Y/Y, down from 17.5% in May and 16.2% in March. The statewide median sales price declined slightly (0.3%) from the record high reached in May. Going forward, slowing sales and rising inventory are likely to result in home price growth moderating to the 8-10% range. Much-needed inventory arrived in June, with statewide listings rising 15.4% from May and 29% from one year ago. Inventory is still relatively tight as the 12,843 properties listed for sale is 35.5% below the five-year average of 19,915. Unsold inventory was at 1.8 months of supply, up from 1.2 one year ago. Sales: According to the Alabama Association of Realtors, June home sales in the state decreased 13.1% Y/Y from 8,234 to 7,159 closed transactions. Following seasonal trends, sales increased 1.3% from May. Sales are down 3.2% year-to-date. Two more resources to review: Quarterly Report and Annual Report. For all statewide housing data, click here. Inventory: June listings (12,843) increased 15.4% from May and 29% from one year ago. At the current sales pace, all the active inventory on the market would sell in 1.8 months, up from 1.6 in May and 1.2 in June 2021. The equilibrium point where buyers and sellers have roughly equal bargaining power is 4-5 months of supply. Pricing: The statewide median sales price in June was $241,982, a decrease of 0.3% from May and an increase of 11.7% from one year ago. The differing sample size (number of residential sales of comparative months) can contribute to statistical volatility, including pricing. ACRE recommends consulting with a local real estate professional to discuss pricing, as it will vary from neighborhood to neighborhood. Homes sold in June averaged 38 days on the market, a record low and ten days fewer than one year ago. Forecast: June sales were 413 units, or 5.5%, below the Alabama Center for Real Estate’s (ACRE) monthly forecast. ACRE projected 7,572 sales for the month, while actual sales were 7,159 units. ACRE forecast a total of 37,624 sales in the state year-to-date, while there were 38,014 actual sales through June, a difference of 1%. New construction: The 1,003 new homes sold represent 14% of all residential sales in the state in June. Total sales increased 4.4% from May and were equal to one year ago. The median sales price increased 4.9% from May to a record high of $344,800, an increase of 28.5% year-over-year. New homes sold in an average of 29 days, eight days faster than in June 2021. National summary: According to the National Association of Realtors (NAR), existing home sales declined for the fifth consecutive month in June, falling 5.4% from May (seasonally adjusted annual rate). Three of four regions of the country reported month-over-month declines, while sales were down year-over-year in all regions, falling 14.2% from June 2021. The median sales price for all housing types increased 13.4% Y/Y to a record high of $416,000, the 124th consecutive Y/Y gain. Properties sold in an average of just 14 days, the fastest pace on record. Inventory is slowly trending upward from the lows seen during the post-pandemic housing boom. The 1,260,000 listings at the end of June increased 9.6% from May and 2.4% from one year ago. June’s three months of supply increased from 2.6 during May and 2.5 one year ago. Lawrence Yun, chief economist for NAR, said, “falling housing affordability continues to take a toll on potential home buyers. Both mortgage rates and home prices have risen too sharply in a short span of time.” Yun also commented on rising inventory, saying, “Finally, there are more homes on the market. Interestingly, though, the record-low pace of days on market implies a fuzzier picture on home prices. Homes priced right are selling very quickly, but homes priced too high are deterring prospective buyers.” All-cash sales represented 25% of all closed sales in June, the same as the prior month and up from 23% one year ago. Second-home buyers and individual investors purchased 16% of June home sales, unchanged from May and up slightly from 14% one year ago. Foreclosures and short sales accounted for less than 1% of June transactions, unchanged from May 2022 and June 2021. Click here to view the entire monthly report. The Alabama Residential Monthly Report is developed in connection with the Alabama Association of Realtors. Republished with the permission of The Alabama NewsCenter.
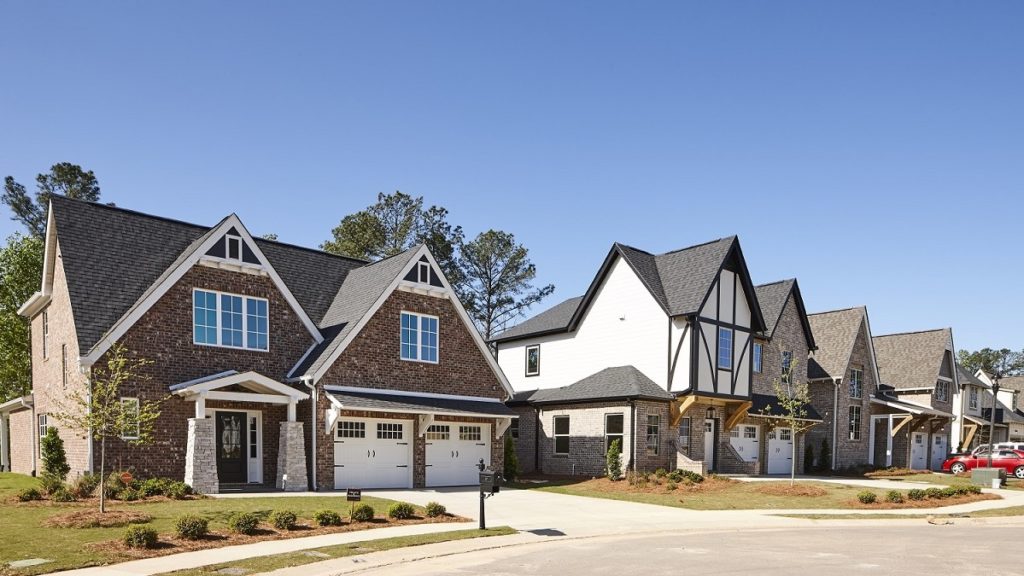
Alabama’s residential new construction market continues to expand

Sales of newly constructed homes in Alabama continued to grow in February. New construction sales increased 22 percent from January and increased 14 percent from February 2017. Statewide*, 507 newly constructed homes were sold in February, up from 416 total sales in January and up from 445 total sales in February 2017. Year-to-date, new construction sales are up 6 percent from 2017. Alabama’s new construction market grew at a faster pace than the nation’s as a whole during February. Nationwide, new construction sales increased 8.5 percent from January, when approximately 47,000 units were sold. There were approximately 51,000 newly constructed homes sold nationwide during February, showing no change from one year ago. Although the total number of homes listed for sale both in Alabama and in the nation is trending downward, new construction inventory continues to grow in both Alabama and the United States. During February there were 3,138 new construction units listed for sale in the state, an increase of 1.9 percent from January and an increase of 20.9 percent from February 2017. During February approximately 301,000 new construction units were listed for sale nationwide, an increase of 1.4 percent from January and an increase of 16.2 percent from February 2017. There were 6.2 months of supply in Alabama’s new construction market during February, while there were 5.9 months of supply nationwide. However, Alabama’s new construction market did go against national trends in one area: pricing. Statewide, the median sales price for new construction was $224,470 during February. The median sales price decreased 1.7 percent from January and decreased 3.5 percent from February 2017. Nationwide, the median sales price was $326,800 during February, representing an increase of 0.6 percent from January and an increase of 9 percent from February 2017. Building permits and housing starts are early indicators of activity in the new construction market, and they are also helpful when measuring overall economic conditions, as the housing market is one of the first sectors to rise or fall when the economy grows or contracts. Permit data for new housing also show that Alabama’s new construction market is growing at a faster rate than the nation as a whole. Statewide, 1,225 building permits for new construction were issued during February. Permits increased 1.1 percent from January and increased 10.1 percent from February 2017. Nationwide, 92,091 permits were issued, representing a decrease of 4.7 percent from January and an increase of 8.6 percent from February 2017. According to the U.S. Census Bureau, “start of construction occurs when excavation begins for the footings or foundation of a building.” The Alabama Center for Real Estate uses building permit data to calculate projected housing starts. Statewide, there were 1,219 housing starts during February, a decrease of 2.9 percent from January and an increase of 13 percent from February 2017. Using the same calculation, ACRE projected 95,555 housing starts nationwide during February, a decrease of 0.7 percent from January and an increase of 9.1 percent from February 2017. Building permits and housing starts are growing in Alabama and the United States, and this is encouraging news for economic conditions going forward. Total New Construction Sales in Select Alabama Markets February 2018 January 2018 February 2017 Baldwin County 100 73 44 Birmingham Metro 125 89 135 Huntsville Metro 112 110 117 Lee County 36 30 34 Limestone County 46 37 32 Mobile Metro 17 17 17 Montgomery Metro 35 24 29 Tuscaloosa Metro 15 14 16 *ACRE receives new construction sales data from the following counties/areas: Baldwin County, Birmingham Metro Area, Calhoun County, Huntsville Metro Area, Lee County, Mobile Metro Area, Montgomery Metro Area, Tuscaloosa County and the Wiregrass Region. Combined, these counties/areas represent +/- 70 percent of Alabama’s total population.
Huntsville October home sales rise 31 percent from last year
Sales According to the North Alabama Multiple Listing Service, Huntsville/Madison County residential sales totaled 600 units during October, a growth in sales of 31 percent from the same period last year. Year-to-date sales increased 11.9 percent from 2016. Two more resources to review: Quarterly Report and Annual Report. For all of Huntsville’s area housing data, click here. Forecast Closed transactions in September were 112 units or 22 percent above the Alabama Center for Real Estate’s monthly forecast. ACRE’s year-to-date sales forecast through September projected 5,071 closed transactions, while the actual sales were 5,913 units, a favorable difference of 16 percent. Supply The Rocket City’s housing inventory totaled 2,116 units, a decrease of 19.2 percent from last October. New home inventory is down 502 units year-over-year, while existing single-family inventory is down 529 units. The inventory-to-sales ratio in September was 3.7 months of housing supply. The market equilibrium (balance between supply and demand) is considered to be about 6 months. The market in September experienced a 2.1 percent decrease in inventory when compared to August. Historical data indicate a typical 0.3 percent increase from August to September. Demand Residential sales in October increased by 1.4 percent from September. New home sales made up 26 percent of sales, a decrease from 21 percent in October 2016. Existing single-family home sales accounted for 71 percent of total sales, up from 76 percent, while condos were 3 percent of sales, the same as the prior year. Pricing The Huntsville median sales price in September was $194,556, an increase of 11.2 percent from October 2016 and 3 percent from the prior month. Pricing can fluctuate as the sample size of data is subject to seasonal buying patterns. ACRE recommends contacting a local real estate professional to discuss pricing at the neighborhood level. Industry perspective “The first print of third-quarter economic growth showed surprising resiliency. The expected economic hit from the recent natural disasters either failed to materialize or was drowned out by business optimism,” said Fannie Mae Chief Economist Doug Duncan. “Recent data showed a stronger pickup in domestic demand than anticipated, leading us to increase our growth forecast for the final quarter of this year and coming quarters. We also revised higher our 2018 growth forecast to 2 percent. Tax cuts, if enacted, present upside risk to our growth forecast for next year but could also lead to more aggressive Fed action. Housing still remains a drag on the economy, as shortages of labor and available lots, coupled with rising building material prices, further complicate existing inventory, affordability and sales challenges.” The Huntsville/Madison County Residential Monthly Report is developed in conjunction with the Huntsville Area Association of Realtors to better serve North Alabama consumers.
Demographic shifts could lead to household, construction boom in the South
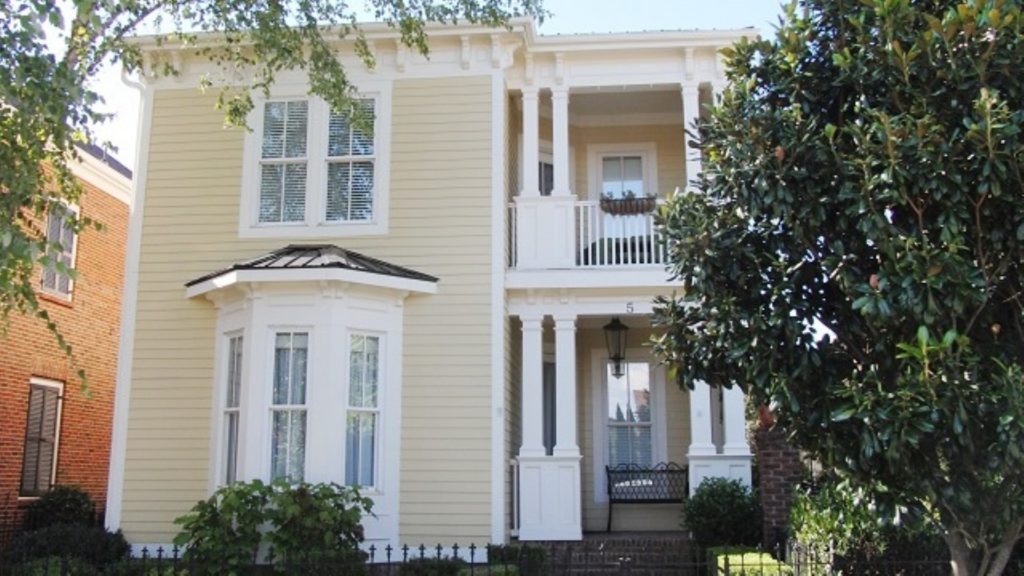
The Southeast is positioned to see tremendous growth in both population and housing over the next 10 years. The South is expected to see some of the strongest population and household growth in the next decade. (From Big Shifts Ahead: Demographic Clarity for Business) According to Chris Porter, co-author of Big Shifts Ahead: Demographic Clarity for Business (co-authored with John Burns), the trend of migration toward the Sunbelt states has been happening for a while, but this could increase exponentially over the next decade for a variety of reasons. “We think it is going to accelerate mostly because you have an older population in the Midwest and the Northeast – those are generally colder areas – and they are in search of warmer areas as they retire,” Porter said in a recent interview with the Alabama Center for Real Estate. The number of Americans age 65 and older is expected to increase 38 percent over the next decade, with more than 66 million Americans having reached their 65th birthday. Porter said many retirees and future retirees already have second homes in states like Florida, but as they move further into retirement age, those second homes may become their primary residences. Alabama’s Gulf Coast is home to a thriving condo market, where many of these developments already serve as second homes and vacation homes for people who live in other regions of the country. Two other reasons the authors give for this migration are employment and affordability. “Affordability plays into that as well,” Porter said. “When you look at the cost of housing, it’s generally people’s biggest expense.” Single-family housing permits in the South grew from fewer than 1.3 million during the 1960s to 3-plus million during the 2000s. (From Big Shifts Ahead: Demographic Clarity for Business) As younger households follow employment and affordability opportunities south, Porter said this will also draw more retirees. “The coming generation of retirees wants to live near their grandkids, and their children will find better employment opportunities in the South,” the book said in a chapter dedicated entirely to this predicted southern migration. According to the book, the Southeast accounts for 23 percent of all residential construction, with the South issuing fewer than 1.3 million construction permits for single-family homes in the 1960s, compared to 3-plus million during the 2000s. Alabama continues to attract manufacturers to the state, ranging from auto plants to the 2,000 jobs at Remington in Huntsville. While Texas is expected to see the largest amount of growth among the southern states, Porter said Alabama could take advantage of a new trend he and Burns call Surban living, which brings many attractions of urban life to suburban living. “It’s very appealing to younger people who may live in a city for a while, who are maybe ready to settle in the suburban areas but want to bring some of that urban living environment with them,” Porter said. Huntsville’s Village at Providence, a development outside of downtown Huntsville, which has retail, apartment, single-family, lodging and employment, fits the Surban lifestyle. Porter said cities that focus on their downtowns over the next 10 years could bring in more households. “I think if more cities invest in their downtown with a mix of retail and residential and entertainment, that can certainly be appealing to drawing new households to the area, especially if the jobs are available as well,” he said. Republished with permission of Alabama NewsCenter.
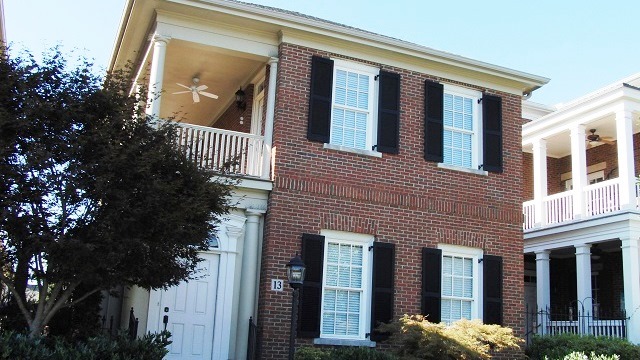
Birmingham February home sales up 5 percent over same period a year ago

Click here to view or print the entire monthly report compliments of the ACRE Corporate Cabinet. Sales: According to the Greater Alabama Multiple Listing Service, Birmingham metro-area residential sales totaled 971 units during February, 5 percent above the same time last year. Total 2016 home sales during February were 924. Two more resources to review: Quarterly Report and Annual Report. For all of the Birmingham area’s housing data, click here. Birmingham February home sales rose 5 percent over 2016 to 971 units. Forecast: February sales were 56 units or 5 percent below the Alabama Center for Real Estate’s (ACRE) monthly forecast. ACRE’s 2017 sales forecast through February projected 1,895 closed transactions, while the actual sales were 1,805 units. Supply: The Birmingham-area housing inventory in February was 5,912 units, an increase of 2 percent from February 2016 and down 50 percent from the February peak in 2008 (11,919 units). February inventory in the Birmingham metro area also increased 0.7 percent from January. This direction is consistent with seasonal patterns and historical data indicating that February inventory on average (2012-16) increases from January by 0.9 percent. According to the Greater Alabama MLS, in the Birmingham metro-area market, there were 6.1 months of housing supply during February, down 2.5 percent from 6.2 months of supply during February 2016. The “months of housing supply” is a simple calculation – homes listed (supply) divided by homes sold (demand). In general, about 6 months is considered the point of equilibrium during February. Demand: February residential sales increased by 16 percent from the prior month. This direction is consistent with historical data indicating that February sales, on average (2012-16), increase from January by 20 percent. Existing single-family home sales accounted for 83 percent of total sales, up from 82 percent in February 2016, while 14 percent were new home sales (unchanged) and 3 percent were condo sales (down from 4 percent). Pricing: The median sales price in February was $175,650, an increase of 3 percent from February 2016 ($171,000). The February median sales price decreased 5.1 percent from January. This direction contrasts with historical data (2012-16) indicating that the February median sales price on average increases from January by 4 percent. Pricing can fluctuate from month to month as the sample size of data is subject to seasonal buying patterns. ACRE recommends consulting with a local real estate professional who has access to pricing data at the neighborhood level. Industry perspective: “We expect the housing expansion to continue, albeit at a more moderate pace than last year given continued pressure on affordability,” said Fannie Mae Chief Economist Doug Duncan. “Depressed inventory, particularly in the more affordable segments, will likely constrain sales and push home price gains that outpace income growth. A faster pace of monetary tightening, unless accompanied by a stronger increase in household income, also poses downside risk to housing.” Click here to generate more graphs from the Birmingham February Housing Report, including Total Sales, Average Sales Price, Days on the Market, Total Inventory and Months of Supply. The Birmingham Residential Monthly Report is developed in conjunction with the Greater Alabama MLS and the Birmingham Association of Realtors to better serve Birmingham metro-area consumers. Republished with permission of Alabama NewsCenter.