Justin Bogie: What is a labor union, and what could unions mean for Alabama?

Over the past year, unionization has been a hot topic in Alabama. An Amazon facility in Bessemer has twice voted on the issue of unionization, with workers choosing not to form a union both times. Recently, workers at a Starbucks in Birmingham voted to organize, becoming the first Starbucks in Alabama with unionized labor. But what does being part of a workers union really mean, and how might continuing efforts to expand unionization impact Alabama? Worker’s unions have existed in America almost as long as the country itself, with the first being formed in Philadelphia, Pa., by shoemakers in 1794. According to the Bureau of Labor Statistics (BLS), 10.3% of America’s public and private workforce (14 million individuals) belong to unions. When the BLS first began collecting unionization data in 1983, membership was almost twice as much. The highest unionization rates are among workers in education, steelworking, automotive manufacturing, electrical workers, and public safety-related occupations. Half of the U.S.’ unionized workforce comes from the public sector, which creates a concerning conflict of interest given the fact that these jobs are funded by elected officials who may be dependent on those same union members’ votes to remain in office. Nationally, Hawaii (22.4%) and New York (22.2%) have the highest union membership rates, while South Carolina (1.7%) and North Carolina (2.6%) have the lowest. In 2021, union members comprised 5.9% of Alabama’s wage and salary workforce, down 2.1% from 2020. Ten states had rates below 5% last year. In 2019 it was estimated that 34% of Alabama’s public sector workers were union members, while just 6.4% of private-sector employees were unionized. A union can be defined as “an organized group of workers who unite to make decisions about conditions affecting their work.” The idea is that by joining a union, a collective group of workers will have more power than they would as individual employees. This could mean negotiating for better pay, hours, benefits, and addressing workplace safety issues, among other things. Unions are supposed to work as a democracy, where elections are held to choose officers who will then make decisions on behalf of union members. Often there will be a local union that is affiliated with a national or international organization. Some of the supposed benefits of being a union member include higher wages and better benefits, greater personal upward mobility, improved working conditions, and improved job security. While in theory, these may sound like good things, in practice, it is more complicated. Just as with the United States’ democratic government structure, structuring a union to function as a democracy means there will be those who wield great power, while rank and file members may have little say in decisions. There are numerous potentially negative consequences of being part of a labor union. First, unions require members to pay dues, which go towards paying the salaries of union leadership and are supposed to supplement workers’ salaries during a work stoppage. Being part of a union means that you have less autonomy to make your own decisions. Like it or not, union members are bound by the decisions made by the group as a whole. Another potentially harmful impact of union membership is that it could slow your chances for workplace advancement. As with our government, in many cases, advancement is tied to seniority. Regardless of merit or your work performance history, if you have less experience than other employees, then you will be more likely to get passed over for a promotion or laid off when company cutbacks are implemented. Workplace promotion should be based on performance, not who has been there the longest. It has also been found that unions create tension within the workplace. Unions can put workers at odds with their employers more often than if employees were not part of an organized labor force. This can lead to lower levels of trust and satisfaction in the workplace. Finally, there is the question of how those dues that workers pay to unions are being used. A recent example of the potential misuse of union funds is the National Education Association (NEA). To clarify, the NEA and its subsidiaries are technically professional organizations but perform many of the same functions as a labor union. According to an NEA report filed with the U.S. Department of Labor last year, the organization had total revenues of more than $588 million in 2021. Just $32 million of that revenue (5.4%) was used for what is referred to as “representation activities.” In other words, only a small percentage of the dues collected by the NEA was going towards bargaining for better pay and improving the working conditions of rank-and-file teachers. Meanwhile, the NEA’s president was paid an annual salary of more than $430,000. Four other NEA executives were paid salaries ranging from $334,219 to $406,951. Another $65 million – more than twice what NEA spent on representing teachers – was spent on political campaigns and lobbying, with 94% of NEA’s political contributions supporting Democrat candidates. Virginia Gentles, director of the Education Freedom Center of Independent Women’s Voices, responded to the report saying, “Rather than advocating for increased salaries for teachers, union leaders lobby for more federal and state funding so school districts will hire more dues-paying members, many of whom aren’t actually teachers.” While questionable motives and use of funds are not limited to teachers’ unions, it would lead you to question what one of Alabama’s largest unions and the NEA subsidiary, the Alabama Education Association (AEA), is doing with dues collected from its membership. According to the AEA, its membership is more than 84,000 of the state’s education employees. That includes not only teachers but administrators, support personnel, etc. Each AEA member pays annual dues that start at $210 per year and then increase depending on your job and where you live. According to fiscal year 2020 tax filings with the Internal Revenue Service, the AEA reported more than $17 million in revenues that year and spent more than $15.5 million. Over $13 million in revenue came from membership dues. More than half of AEA’s expenses went towards salaries, other compensation,
Majority of Americans say they are ‘falling behind’ rising cost of living
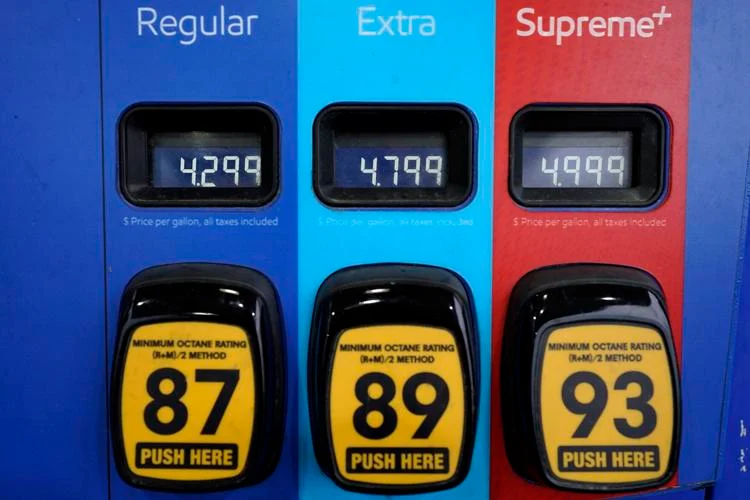
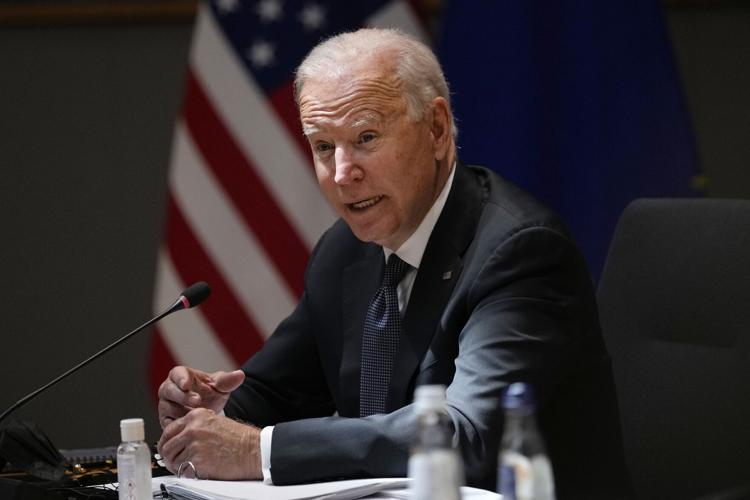
The majority of Americans feel they cannot keep up with the cost of living as inflation and the price of goods continue to rise, according to new polling data. A poll from NBC News asked Americans, “Do you think that your family’s income is … going up faster than the cost of living, staying about even with the cost of living, or falling behind the cost of living?” In response, 65% said they are falling behind, and 28% said they are staying about even with the cost of living. Only 6% said their income is going up faster than the cost of living.” The poll comes amid soaring inflation and gas prices. U.S. gasoline prices hit another record high Monday, with Americans paying $4.48 per gallon average for a gallon of regular gasoline. Gas prices have risen about 40 cents in the past month alone. The average price per gallon was $3.04 a year ago, a $1.44 increase. The latest inflation data has also shown a significant rise in prices since President Joe Biden took office, with price increases outpacing wage gains. Consumer prices have risen at the fastest rate in decades. “The Consumer Price Index for All Urban Consumers (CPI-U) increased 0.3 percent in April on a seasonally adjusted basis after rising 1.2 percent in March…” the Bureau of Labor Statistics says. “Over the last 12 months, the all items index increased 8.3 percent before seasonal adjustment.” Biden has defended his work on the economy, pointing to the jobs recovered since the pandemic. Republicans, though, point to inflation and problems with the labor market. “As Americans face record-high prices at the pump, President Biden is continuing his war on American energy by canceling oil and gas leases in Alaska and the Gulf of Mexico,” said Rep. Kevin Brady, R-Texas. “Working families are already suffering from Biden’s inflation crisis and harmful policies.” Republished with the permission of The Center Square.
J. Pepper Bryars: Inflation rate hits 12.5% (the real one, anyway)

Now that it’s the end of April, the federal government will soon release the latest numbers from the Consumer Price Index to officially tell us exactly how much inflation has risen in the past year. Some people will probably call “BS” on whatever number is generated by the CPI, though, because they believe it’s either inadvertently flawed, purposefully manipulative, or so dense and detached that it’s become practically useless as a means of measurement. And there’s just no amount of political spin or economic theorizing that can explain those concerns away. Like so many other aspects of our institutions, many people have simply lost trust in the CPI. That’s why I created my own index — a “No BS” one, or NBS-CPI as I like to call it — to measure precisely how much more I’m personally spending on my family’s primary non-fixed expenses — groceries and gas. And since we mostly shop through the Walmart Grocery App, I have detailed receipts to base the calculations upon. So, when a literal apples-to-apples price comparison is made between what I paid for something at Walmart in April 2021 and what it cost now in April 2022, plus the price of regular unleaded down the road, my own NBS-CPI shot up to slightly more than 12.5%. That number is probably much closer to measuring the true level of inflation being felt by our nation’s families, and it hasn’t been that high since President Ronald Reagan took office in January 1980. Here are the numbers: So, what’s up with the CPI? Some think the measurement was fundamentally broken after the Bureau of Labor Statistics, which comes up with the number, moved away from tracking a fixed list of products to one where items are removed or added based on price or quality fluctuations. Critics of the CPI, like stock trader and financial commentator Peter Schiff, have explained that until a couple of decades ago, government economists would track the price of the same basket of products, and the resulting changes would be averaged together to create the inflation rate. If broccoli was in the basket, it stayed in the basket. But some economists began arguing that a fixed basket isn’t how people actually shop. They said that if a product becomes too expensive, a shopper would scratch it off their grocery list and replace it with something else less expensive. So, if broccoli suddenly costs too much, economists assume shoppers will replace the broccoli with, say, Brussel sprouts. And then, the CPI starts tracking the less expensive product. It’s clear to see what they’re trying to do — base their measurement on dynamic, human behavior rather than a static list — but the flaw in their model is the many assumptions they have to make, and some are probably wrong. (I wouldn’t swap broccoli for Brussel sprouts in my house, for instance. It’d be a total waste. I’m sure you have limitations like that, too). The Bureau of Labor Statistics conducts surveys and market research to inform those assumptions and make those changes, it says, so they’re not done on a whim. But still, when you dig into what changes they’ve made and then look at your own behavior (and your own grocery receipts!), it just doesn’t seem right. Then there’s the argument that the bureaucrat-economists at the Bureau of Labor Statistics have simply made all this far too complicated. For instance, one would think that coming up with the rate of inflation for a product is a simple calculation: Increase in Price ÷ Original Price x 100 = % Increase. Do that for the entire basket of products you’re tracking, get the average percentage of them all, and voilà — the inflation rate. That’s how I calculated my NBS-CPI. Nope Here’s just one of the formulas they use at the Bureau of Labor Statistics to calculate the CPI: U.S. Bureau of Labor Statistics Decades of problem solving, generations of added processes, and the natural tendency of bureaucracies to construct Byzantine-like labyrinths rather than draw straight lines from problems to solutions has created a Rube Goldberg Machine to calculate what could originally be worked out by a fourth-grader. Professor Butts and the Self-Operating Napkin (Rube Goldberg, Collier’s,1931) This is one reason people distrust these numbers: people aren’t capable of checking the government’s homework, and when they take a look, they see a myriad of perplexing systems and confusing jargon. This causes some to believe it’s all a scam and that these measurements are systemically manipulated for the benefit of those with wealth and power. Maybe. After what happened in the subprime mortgage crisis a few years ago, I wouldn’t put anything past Wall Street and their lackeys in Congress. Much of how the world works can be explained by incentives — what reason does a person have to do one thing and not the other? That, and repeating the question the great orator Cicero asked when evaluating legal claims: “Cui bono?”, which is a Latin phrase meaning “who benefits?” Find out what the incentives are for an action, and who benefits from it, and you’re probably going to be in the ballpark. The keyword in the title “government economist” is, alas, government. And with the CPI, we’re essentially trusting the government to not only grade its performance in managing the economy, but to create the test, and then change the questions when it doesn’t like the answers. The incentive, however underlying it may be, is to produce the lowest number for inflation possible. And who benefits? Consider what’s hitched to inflation — automatic cost-of-living increases for government employees, some large private employers, and retirees. While not automatic, higher inflation certainly gives employees across the board more of a justification to demand increased wages. And while I’m uncertain, I suspect that Wall Street has managed to make money from all of this. Maybe someday we’ll learn exactly how. Going Forward We’ll see how close the real CPI is to my own NBS-CPI in just
Americans more worried about inflation than they have been in decades
Americans are more concerned about inflation than they have been in decades as prices continue to soar nationwide, according to newly released polling. Gallup released a new poll showing that Americans say the economy is the most important problem, more than any other topic. “Americans’ confidence in the economy remains very low, and mentions of economic issues as the most important problem in the U.S. are at their highest point since 2016,” Gallup said. “Inflation, which registered as the top economic problem last month and continues to be, was previously at this level in 1984.” A key part of Americans’ concern over the economy has been rising energy costs. Federal data on the consumer price index show energy costs are the leading cause of price hikes but that prices have risen dramatically across all kinds of goods and services. “Increases in the indexes for gasoline, shelter, and food were the largest contributors to the seasonally adjusted all items increase,” the Bureau of Labor Statistics said in its report released earlier this month. “The gasoline index rose 18.3 percent in March and accounted for over half of the all items monthly increase; other energy component indexes also increased. The food index rose 1.0 percent, and the food at home index rose 1.5 percent.” According to AAA, gas prices have risen well over a dollar per gallon in the past 12 months. Polling has consistently shown that voters believe Joe Biden’s policies have contributed to inflation, but new Rasmussen Reports polling found voters also blame Biden for rising fuel costs specifically. The poll found that 61% of voters say Biden has not done enough to address gas prices. Biden has blamed Russia’s invasion of Ukraine for higher prices, but Rasmussen’s survey found only 15% of surveyed Americans blame Russian President Vladimir Putin, compared to 51% who blame Biden. “The latest Rasmussen Reports national telephone and online survey finds that 84% of Likely U.S. Voters believe the rising price of gasoline, home heating oil, and other petroleum products is a serious problem, including 61% who say it’s a Very Serious Problem,” Rasmussen said. “Only 15% don’t think rising fuel prices are a serious problem.” Overall, these economic problems have led Americans to have less confidence in the economy, Gallup found. “In the latest Gallup poll, conducted April 1-19, four in five U.S. adults rate current economic conditions in the country as only fair (38%) or poor (42%), with few describing conditions as excellent (2%) or good (18%),” Gallup said. “Furthermore, 76% of Americans say the economy is getting worse, 20% say it is improving, and 3% think it is staying the same. The resulting -39 Economic Confidence Index reading is identical to last month but well above the record low of -72 in October 2008, during the Great Recession. The ECI has been in negative territory since July 2021 as Americans have watched the inflation rate climb to its highest levels since 1981 and felt its effects on their own finances.” Republished with the permission of The Center Square.
Inflation causing Americans to doubt Joe Biden on economy, polls show
As inflation continues to raise concerns about the state of the economy, new polling shows voters are doubtful about whether President Joe Biden is taking the issue seriously enough. An ABC/IPSOS poll released Sunday found that 57% of Americans surveyed disapprove of Biden’s economic policies, especially as they pertain to rising inflation. The ABC/IPSOS poll suggests that discontent is largely driven by the inflation issue, with 69% of those surveyed saying they disapprove of how the president is dealing with it. Notably, 71% of Independent voters disapprove of Biden’s handling of inflation. Economic concerns have plagued the Biden administration and gummed up their efforts to get the “Build Back Better” spending plan across the finish line as critics of the plan argue federal debt spending will only make inflation worse. Meanwhile, a newly released poll from the Trafalgar group found that the majority of Americans do not believe Biden is taking the issue seriously enough. Biden has argued his spending plan would combat inflation, though critics dispute that claim. The Trafalgar poll asked, “How concerned do you think President Biden is about the impact that rising costs and inflation is having on Americans?” The poll reports that 56.7% said Biden is “not concerned,” while 43.2% said he is “concerned.” The Department of Labor’s Bureau of Labor Statistics released new data last week on the consumer price index, a leading marker of inflation. The CPI reported a 6.8% increase in prices in the previous 12 months. “The all items index rose 6.8 percent for the 12 months ending October, the largest 12-month increase since the period ending June 1982,” BLS said. “The index for all items less food and energy rose 4.9 percent over the last 12 months, while the energy index rose 33.3 percent over the last year, and the food index increased 6.1 percent. These changes are the largest 12-month increases in at least 13 years in the respective series.” Gas prices have also risen significantly and brought their own political challenges for the president. “The monthly all items seasonally adjusted increase was the result of broad increases in most component indexes, similar to last month,” BLS said. “The indexes for gasoline, shelter, food, used cars and trucks, and new vehicles were among the larger contributors. The energy index rose 3.5 percent in November as the gasoline index increased 6.1 percent, and the other major energy component indexes also rose. The food index increased 0.7 percent as the index for food at home rose 0.8 percent.” By Casey Harper | The Center Square Republished with the permission of The Center Square.
Job creation for September falls far short of expectations
The Bureau of Labor Statistics released the monthly jobs report Friday, showing the economy created far fewer jobs in the month of September than experts expected. Total nonfarm employment increased 194,000 in September, well below the Dow Jones estimated 500,000 jobs for the month. “Notable job gains occurred in leisure and hospitality, in professional and business services, in retail trade, and in transportation and warehousing,” BLS said. “Employment in public education declined over the month.” In August, the economy created 235,000 jobs, only a third of the predicted 720,000. This month, even after experts dropped their predictions by nearly a third, job creation failed to meet their expectations with even fewer jobs than the previous month. “In September, the number of persons employed part-time for economic reasons, at 4.5 million, was essentially unchanged for the second month in a row,” BLS said. “There were 4.4 million persons in this category in February 2020.” The report showed a drop in unemployment from 5.2% to 4.8%. “The unemployment rate fell by 0.4 percentage point to 4.8 percent in September,” BLS said. “The number of unemployed persons fell by 710,000 to 7.7 million. Both measures are down considerably from their highs at the end of the February-April 2020 recession. However, they remain above their levels prior to the coronavirus (COVID-19) pandemic (3.5 percent and 5.7 million, respectively, in February 2020). Among the major worker groups, the unemployment rates for adult men (4.7 percent), adult women (4.2 percent), Whites (4.2 percent), and Blacks (7.9 percent) declined in September. The jobless rates for teenagers (11.5 percent), Asians (4.2 percent), and Hispanics (6.3 percent) showed little change over the month.” That data comes after the Department of Labor released unemployment figures for the week ending October 2 that showed first-time unemployment claims decreased to 326,000, a drop of 38,000 from the previous week. Those numbers reversed a several-week trend of rising unemployment. “The highest insured unemployment rates in the week ending September 18 were in Puerto Rico (4.5), Illinois (4.2), California (3.1), Hawaii (3.0), New Jersey (2.9), Nevada (2.8), Alaska (2.7), Oregon (2.7), Louisiana (2.5), and New York (2.5),” DOL said. By Casey Harper | The Center Square
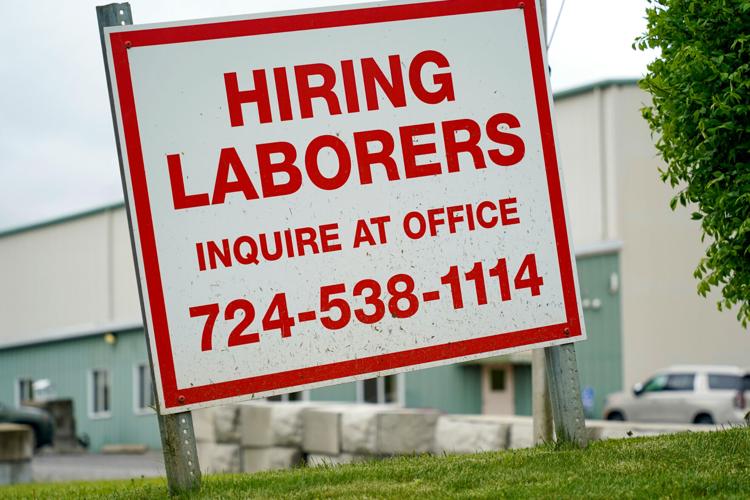
Federal unemployment benefits spur hiring crisis, poll shows
Republicans have argued for months that federal unemployment benefits are keeping Americans from going back to work, and a new survey seems to support that claim. The survey from Morning Consult released Wednesday found that 1.8 million Americans have turned down jobs even though they were unemployed, saying, “I receive enough unemployment benefits without having to work.” The payments in question came as part of the $1.9 trillion COVID relief bill passed earlier this year, which provided weekly $300 unemployment payments on top of state benefits. When business owners complained of the difficulty hiring workers and unemployment remained high despite widespread job availability, critics began to blame the federal benefits. The Morning Consult poll surveyed 5,000 adults in June. Of those polled who were collecting unemployment benefits, “29% said they turned down job offers during the pandemic. In response to a follow-up question, 45% of that group said they turned down jobs specifically because of the generosity of the benefits.” The poll numbers come after dozens of Republican-led states around the country have opted to reject the federal benefits, citing the concerns laid out in the poll. “Here we have solid confirmation that millions of people have remained unemployed because of the federal government’s reckless expansion of the welfare state,” wrote Brad Polumbo of the Foundation for Economic Education. “This is, on its face, even more vindication for the many conservative-leaning states that canceled the benefits early.” Polumbo points to a coming deadline that will likely be a point of debate. The federal benefits are set to expire in September of this year. The poll “offers even more compelling weight to the argument that the federal welfare expansion ought to be allowed to lapse in September as scheduled,” he said. “(There will undoubtedly be a push to extend it; the ‘temporary’ program has already been extended several times).” Some Senate Republicans have already begun the fight against renewing the benefits, with several introducing legislation to end the payments. The “Get Americans Back to Work Act,” introduced in May, would do just that. “Businesses throughout Florida have signs on their doors saying they are understaffed due to the ‘labor crisis,’” U.S. Sen. Marco Rubio, R-Fla., said. “The inability to find employees is a real problem, and small employers across our country are struggling to maintain their businesses. This legislation would help Americans get back to work and help our economy recover.” The senators have also pointed to the troubling economic indicators as signs that a change is needed. Foremost among those indicators is rising inflation. The Bureau of Labor Statistics released data this week showing the continued rise in inflation hitting levels not seen since the 2008 financial crisis. The U.S. Chamber of Commerce responded to that data, calling for it to be taken seriously. The group also called for an immediate end to the federal unemployment benefits. “A severe shortage of workers is causing employers to raise wages beyond the efficiency gains, which means the additional costs must be absorbed or passed along to customers,” the chamber said. “Rising wages are usually good, but in this case, they are at least partially the result of businesses competing with generous government benefits that provide some individuals with more money out-of-work than they earned working. In some cases, workers are on the sidelines because they do not have access to affordable childcare. Congress should act to end the extra $300 federal unemployment benefit immediately. States, as some already have, can end those payments unilaterally and use the funds to provide an incentive for workers to return, such as a return-to-work bonus and assistance with childcare costs.” By Casey Harper | The Center Square
Daniel Sutter: Why go to college?

More than three million students will begin college this year, many pursuing degrees needed for high paying jobs. Amazingly, bachelor’s degrees open economic doors despite little evidence of significant learning in college. How can students who retain so little knowledge make so much money? A college degree can identify people who employers want to hire. A recent book by George Mason University economist Bryan Caplan provocatively titled The Case Against Education argues that this signaling explains much of the college earnings premium. The college earnings premium is real. According to the Bureau of Labor Statistics, in 2018 college grads earned 64 percent more than high school grads who never attended college, and 39 percent more than associate’s degree holders. College grads are also less likely to be unemployed, with a 2.2 percent unemployment rate, versus 4.1 percent for high school grads. The earnings and unemployment differentials have both persisted for years. Businesses require bachelor’s degrees for many jobs. Every time a business chooses college grads, they pay more. Profit-hungry businesses should not hire more expensive workers unless they create more value. Economics offers two theories for education’s value. The first, called human capital, contends that learning makes workers more productive. In the human capital story, the college curriculum must be directly valuable to employers. High paying degrees, like economics, must teach skills businesses value more. Alternatively, college degrees might allow students to signal characteristics which businesses desire; the content of degrees may be largely irrelevant. Life offers many examples of signaling. Romance and courting involve numerous signals, like engagement rings. A diamond is of little practical value, but signals the willingness to make a life-long commitment. What does college signal? Professor Caplan argues three main traits: intelligence, conscientiousness, and conformity. Businesses desire workers who are smart, able to learn challenging material, and willing to follow rules. Conformity is probably becoming more important, as businesses can no longer afford workers who tell off-color jokes or express racial, religious or sexual intolerance. Intelligence and ability to learn are valuable because the details of jobs differ greatly across employers. Employers must train workers to do a job their way. Employees must be willing to turn off their cell phones and pay attention. How important is human capital versus signaling? Discussions of higher education policy generally presume human capital theory. Yet Professor Caplan contends that the college premium is about 80 percent signaling and 20 percent human capital. The content of education clearly has some relevance; engineering firms will not hire inexpensive social work majors over expensive engineers because they prefer graduates already familiar with engineering. Professor Caplan presents a wealth of statistical evidence in support of signaling. Yet several puzzles demonstrate signaling’s importance. Perhaps most telling is the one mentioned above, the lack of evidence on long-term learning. Knowledge forgotten – of Shakespeare, calculus, or supply and demand – cannot be generating productivity. Furthermore, a student who is one or two classes short of a degree has acquired perhaps 95 percent of a degree’s human capital, but will face a significant salary penalty. And attending classes allows acquisition of knowledge without earning college credit, and has essentially no market value. Signaling creates value for the economy even if course content is largely irrelevant. College helps employers find the workers they want. Yes, four years of college is costly, but everyone wants high paying jobs and would likely lie during an interview. Whether higher education provides efficient signaling depends on whether an alternative can separate high and low quality potential workers at a lower cost. The potential exists for excessive and wasteful signaling. Completing high school used to separate one from the crowd. Arguably we now use college degrees as a signal instead of high school diplomas. Credential inflation is potentially costly. For parents of college students, signaling offers some solace. Even if Sally or Johnny seem to forget everything after the semester ends, passing forgettable classes can readily signal employers their willingness to learn a boring job. Daniel Sutter is the Charles G. Koch Professor of Economics with the Manuel H. Johnson Center for Political Economy at Troy University and host of Econversations on TrojanVision. The opinions expressed in this column are the author’s and do not necessarily reflect the views of Troy University.
Dan Sutter: The great truck driver shortage

The Alabama legislature lowered the minimum age for a truck driver’s (CDL) license to 18 for within-state transport (the minimum age remains 21 in interstate trucking) to help alleviate a driver shortage the American Trucking Associations (ATA) says has existed since 2005. Trucking has long been a major employer in Alabama and Pike County. What are the economics of this shortage and the future of trucking? Trucking contributes enormously to our economy. Seventy percent of freight, over 10 billion tons annually, ships via trucks. Our modern economy could not exist without reliable truck transportation; any uncertainty would render just-in-time production impractical. News reports for years have noted trucking companies’ struggles to hire drivers. The most visible have been ads on tractor-trailers encouraging drivers to switch jobs for better pay and working conditions. Our economy shows few signs of a shortage of transport, as stores have remained stocked and factories operating. About 1.7 million people drive “heavy” trucks requiring CDLs, while 1.3 million more drive light delivery trucks. About half of the heavy truck drivers work for trucking companies serving many customers. Most of the remaining drivers work for companies which ship a great deal of freight. Some drivers work as independent owner-operators. According to the Bureau of Labor Statistics, heavy truck drivers earn $44,000 per year. But experienced CDL drivers earn more than $60,000 and team drivers over $70,000. These are solid salaries for “blue collar” jobs requiring only a high school degree. Why then is there a shortage of truck drivers? As an economist, I find the ATA’s claim of a fifteen year shortage noteworthy. Economists expect that prices or salaries will rise to quickly eliminate shortages and fall to eliminate surpluses. What’s going on? Part of the answer may arise from different uses of the term shortage. A recent economic analysis finds that the market for heavy truck drivers has been tight but not in shortage. The ATA estimates the shortage at around 50,000 drivers, or just three percent of all heavy truck drivers. A trucking company can lose business if ever short on drivers and may perceive difficulty hiring as a serious shortage. Truck driver salaries have risen, as we would expect in a shortage, 25 percent between 2005 and 2016, versus a 19 percent increase for all other blue collar jobs. Yet this is a modest increase relative to oil industry salaries during the shale boom. The 14 percent decline in employment during the 2008 recession shows that there were more drivers than loads during a portion of the driver shortage. The training drivers require could potentially limit the supply. Aspiring truckers can learn driving by paying (or borrowing) up to $7,000 for a truck driving school or signing on for training from a trucking company paid for through a lower first year salary. Access to training seems unlikely to significantly limit supply. Long hours and extensive travel constitute a more significant limit. Days on the road make having a life, and particularly a family, difficult. Truckers must be paid extra to accept these undesirable working conditions. And factoring in the unpleasant conditions makes the good pay more apparent than real. Truckers create tremendous value, but the demands of the job heavily burden people. Self-driving trucks might resolve this dilemma. Robot drivers will not miss being away from their family. Artificial intelligence will likely automate jobs people find particularly unpleasant. Self-driving technology could be a boon to truckers. Experts suggest that the technology will be operational on rural interstates long before for urban driving. If so, trucks could drive autonomously between cities, with truckers driving across urban areas. A trucker driving rigs across Birmingham all day could go home every night. Autonomous trucks may not initially reduce the number of drivers, rather change driving arrangements. Efficient, reliable truck transport has enabled America’s prosperity and lifted millions of families into the middle class. Yet the burdensome job conditions make finding drivers difficult. Automation could make both truckers and our economy better off and end the great truck driver shortage. Daniel Sutter is the Charles G. Koch Professor of Economics with the Manuel H. Johnson Center for Political Economy at Troy University and host of Econversations on TrojanVision. The opinions expressed in this column are the author’s and do not necessarily reflect the views of Troy University.
U.S. jobs report beats expectations, added 201,000 jobs in August

On Friday, the Bureau of Labor Statistics released the national August jobs report, which found the U.S. economy added 201,000 jobs, while the unemployment rate stayed at 3.9 percent. The numbers reveal that the labor market continued to defy worker shortages and trade battles. All in all, the economy has added 1.2 million new, non-farm, payroll jobs over the past 12 months. During which time unemployment rates for all major races and ethnicities dramatically improved (August 2017 to August 2018). Alabama 5th District U.S. Rep. Mo Brooks said the improved numbers are thanks to President Donald Trump and the work of Congress. “Congress and President Trump have worked hard and taken substantial political risks to jump start America’s economy. The tax cuts for American families and job creators, the reduction of Obama-era regulatory burdens, the preference for free enterprise principles over socialism, and the cuts in costly economic dictates by federal bureaucrats in their cubicles and windowless D.C. offices are all paying off,” explained Brooks. Brooks continued, “After a decade of anemic sub-3 percent economic growth, the American economy sizzled at a 4.2 percent growth rate in the 2nd quarter of 2018 and appears to be surging again in the 3rd quarter! American families and workers are enjoying a double whammy of good news: plentiful jobs and bigger paychecks brought about by the double dose of higher wages and lower taxes.” August’s jobs report also revealed the average hourly earnings for all non-farm American workers increased by 10 cents in August and 77 cents (2.9 percent) over the past year. “A 2.9 percent boost in average income over one year is fantastic!,” said Brooks. Brooks however pointed to America’s border problems with illegal immigration as the reason behind the one negative aspect of the new report. “The one big negative in the August report is that the average hourly earnings of ‘production and nonsupervisory employees’ (those most impacted by the surge in illegal alien labor caused by porous borders) increased at a 15 cents per hour slower pace (at 62 cents per hour) than the average for all American workers (77 cents per hour),” added Brooks. “I ask American voters to ponder how much higher their incomes would be if there was no competition from lower wage, and often illegal, foreign labor.”
Alabama is 2018’s third worst state for working moms

Working mothers in the Yellowhammer State deserve the hard-earned break and gifts headed to them this Mother’s Day. But unfortunately, according to a new study from personal finance site WalletHub, 2018’s Best & Worst States for Working Moms, the state ranks as the third worst state in the nation for working moms. That’s up from being the worst state in the nation in 2017. By using data from the U.S. Census Bureau, the Bureau of Labor Statistics, the and the Equal Employment Opportunity Commission, the study found several key methods to determine the scores of each state, including: child care, professional opportunities and work-life balance. The state had very low scores for all three methods, ranking 42nd in child care, 50th in professional opportunities and 43rd in Work-life balance. Alabama also ranked in the bottom five for several categories, worst day care systems, highest gender pay gap, and lowest female executive to male executive ratio. The state ranks 31st in average length of a woman’s workweek, 36.1 hours, 29th for women’s average commute time, 22.8 minutes, and 40th in terms of friendly laws for parental leave. Mobile-Democrat State Rep. Adline Clarke introduced a bill in the 2018 legislative session to close the wage gap in Alabama, but it failed to pass. When asked what else local governments could do to help support working mothers, Elizabeth F. Chapman, Associate Professor of Management at Mercer University said “ensure that there are adequate, quality, affordable child care facilities and excellent public schools. Support can also include efforts to close the wage gap between women and men, while providing development and educational opportunities for women to enter into high-paying positions.” “Governments should have a fair representation of women and men in political positions,” Chapman continued, and with 2018 being called the “Year of the Woman” in Alabama politics, we might actually see some progress for women in the state.
Social Security recipients will see 2 percent boost in 2018
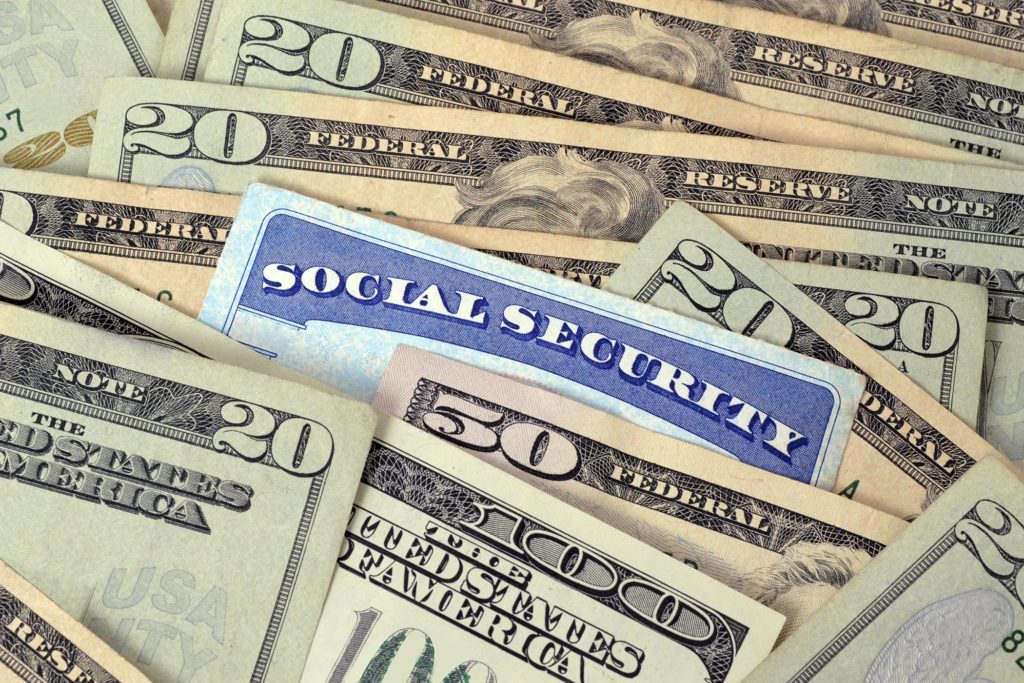
Millions of Social Security recipients and other retirees will get a 2 percent increase in benefits next year, the largest increase since 2012, thought it comes to only $25 a month for the average beneficiary. The cost-of-living adjustment, or COLA, affects benefits for more than 70 million U.S. residents, including Social Security recipients, disabled veterans and federal retirees. That’s about one in five Americans. The Social Security Administration announced the COLA Friday. By law, the COLA is based on a broad measure of consumer prices generated by the Bureau of Labor Statistics. Advocates for seniors claim the inflation index doesn’t accurately capture rising prices faced by seniors, especially for health care. “It doesn’t make your life any easier. It’s really made it tight,” said Barbara Bogart, who retired from a home health care company. “You have to be so careful to make it each month.” Bogart, 75, who lives near Indianapolis, said she gets less than $1,000 a month from Social Security, her only source of income. “I have all the normal costs that people have. I have groceries, gas for my car,” she said. “I have to be cautious.” Some conservatives argue that the inflation index is too generous because when prices go up, people change their buying habits and buy cheaper alternatives. Consumer prices went up only slightly in the past year despite a recent spike in gasoline prices after a series of hurricanes slowed oil production in the Gulf Coast, said Max Gulker, senior research fellow at the American Institute for Economic Research. “For the most part, there was a decline in energy prices for a lot of the year,” Gulker said. “But at the end of the year we saw that uptick in gas from the hurricanes.” The average monthly Social Security payment is $1,258, or about $15,000 a year. Congress enacted automatic annual increases for Social Security in 1975. Presidents often get blamed when increases are small or zero. But President Donald Trump has no power to boost the increase, unless he persuades Congress to change the law. In 2009, President Barack Obama persuaded Congress to approve one-time payments of $250 to Social Security recipients as part an economic stimulus package. Over the past eight years, the annual COLA has averaged just above 1 percent. In the previous decade, it averaged 3 percent. Multiple years of small or no COLA reduces the income of retirees for the rest of their lives, said Mary Johnson of The Senior Citizens League. “Think about the length of a retirement period. Eight years is about a third of a (healthy) retirement,” Johnson said. “It’s squeezing them. It’s causing them to dip into savings more quickly. The lifetime income that they were counting on just isn’t there.” The COLA is based on the Consumer Price Index for Urban Wage Earners and Clerical Workers, or CPI-W, a broad measure of consumer prices. It measures price changes for food, housing, clothing, transportation, energy, medical care, recreation and education. The cost of medical care has gone up by 1.5 percent over the past year, according to the September report released Friday. Housing prices are up by 2.8 percent while the cost of food and beverage has gone up by 1.2 percent. Gasoline prices are up 10 percent from a year ago, according to AAA, though they have dropped in the past month. The COLA is calculated using the average CPI-W for July, August and September, and comparing it to the same three months from the previous year. Social Security is financed by a 12.4 percent tax on wages, with half paid by workers and the other half paid by employers. Next year, the maximum amount of earnings subject to the Social Security tax will increase from $127,200 to $128,700. About 175 million workers pay Social Security taxes. Of those, about 12 million workers will pay more in taxes because of the increase in taxable wages, according to the Social Security Administration. Republished with permission from the Associated Press.